
Company Pages & Tabs
Every company page has a DOWNLOAD DATA SHEET button at the top. Depending on the company, you'll also see up to four tabs, with content described below.
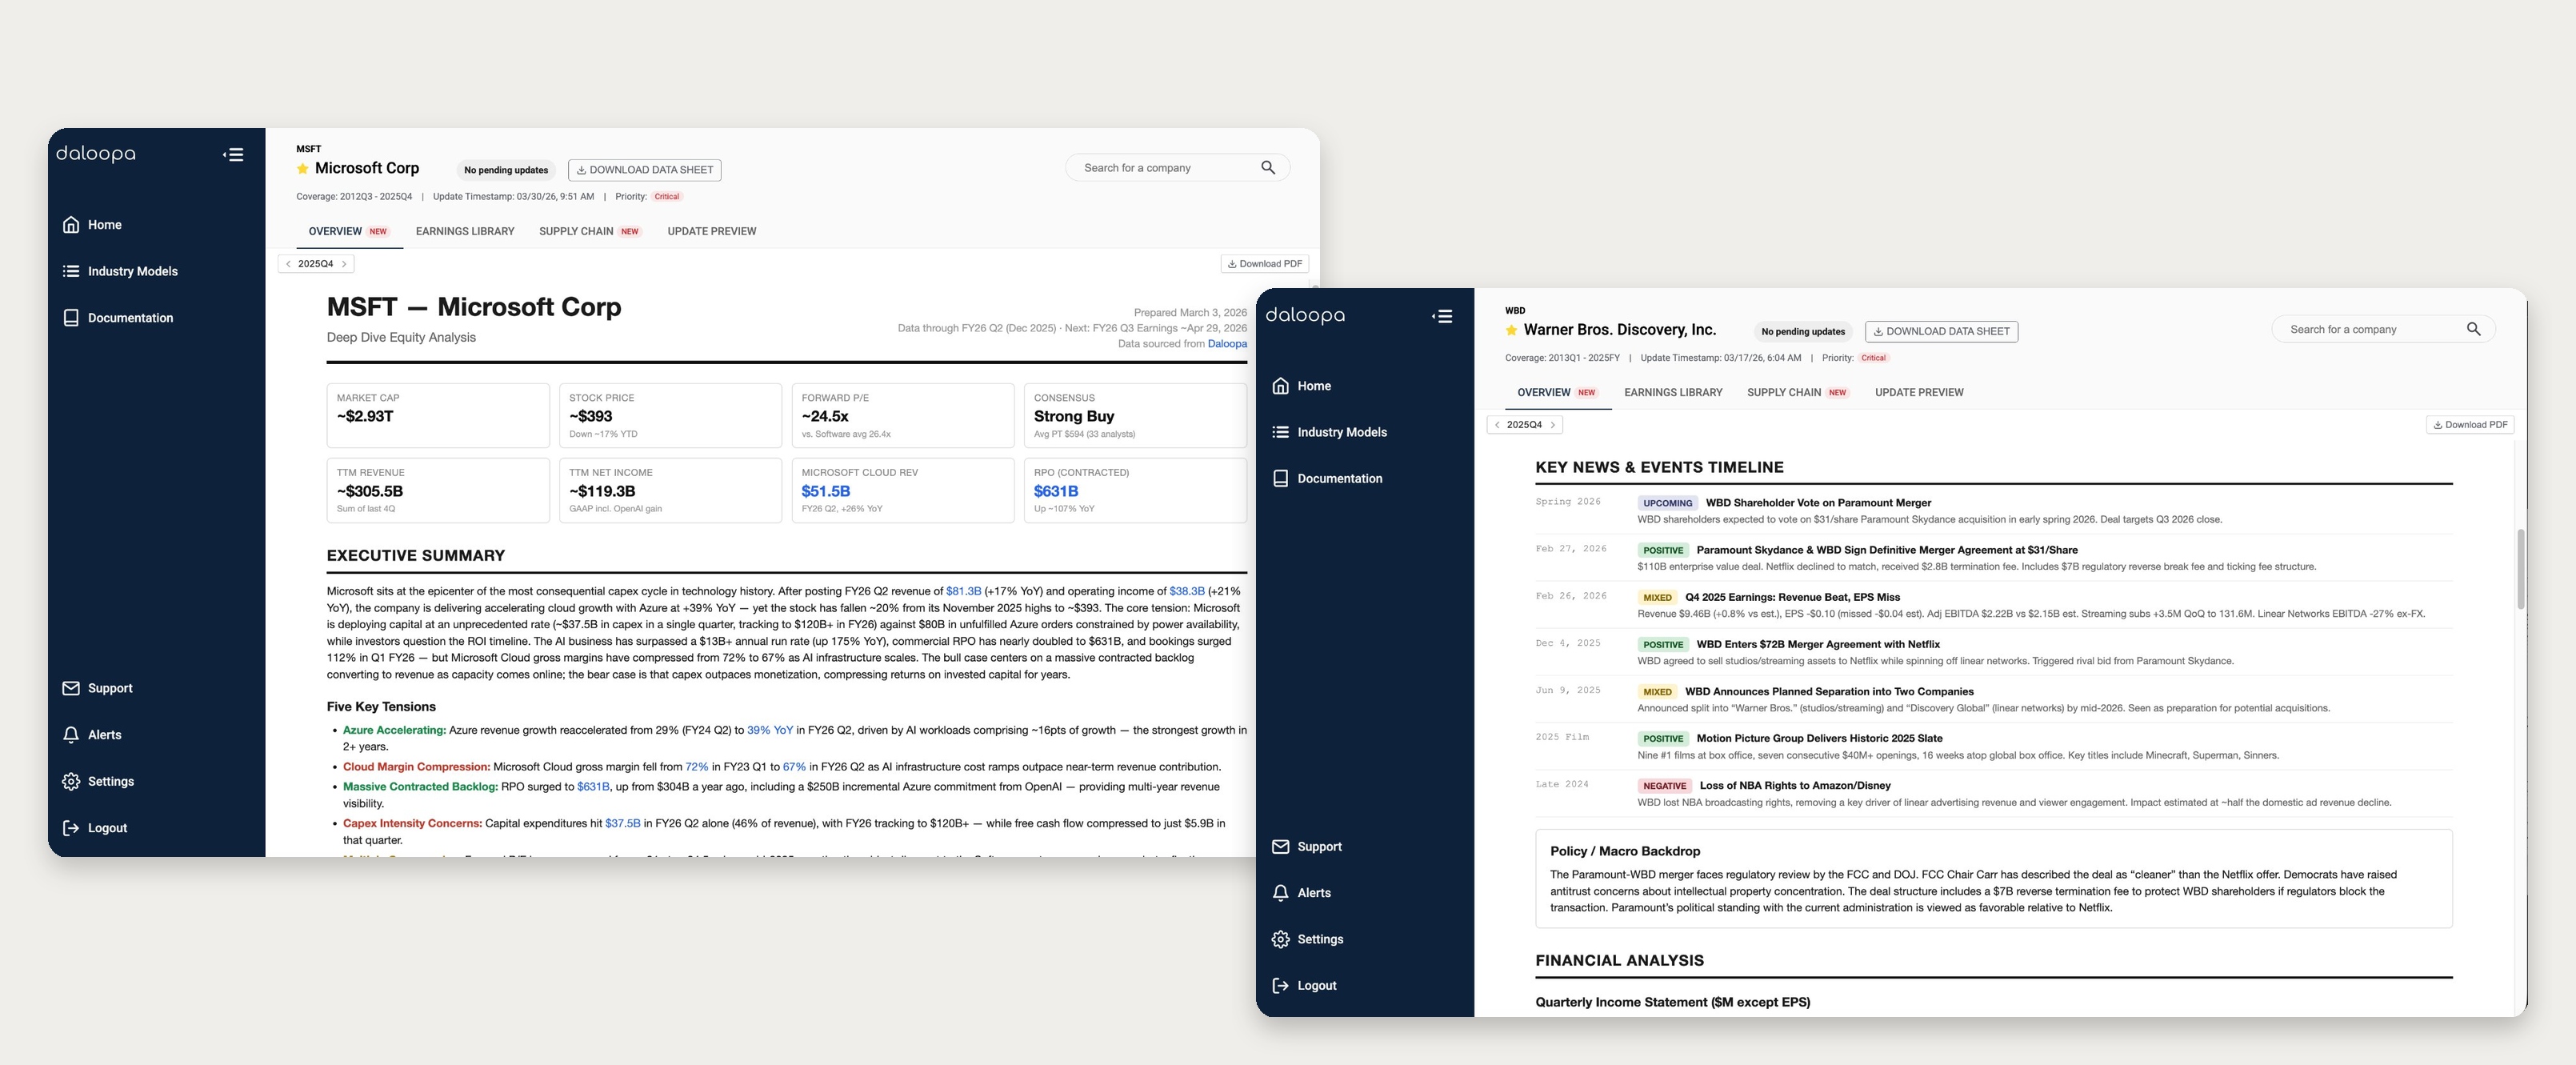
Overview
What the Overview tab shows depends on the company.
- For most large-cap U.S. companies, it shows a research summary and the Earnings Library moves to its own tab.
- For all other companies, the Overview tab contains the Earnings Library directly.
Research summary
(Experimental feature, available for most large-cap U.S. companies. These are point-in-time snapshots, not updated in real time.)
Covers the company's financials, business segments, key debates, near- and medium-term catalysts, and the factors most relevant to understanding the company.
How is the data sourced?
This summary is AI-generated using Daloopa data and public sources. Treat it as research context, not investment advice, and verify anything you plan to rely on.
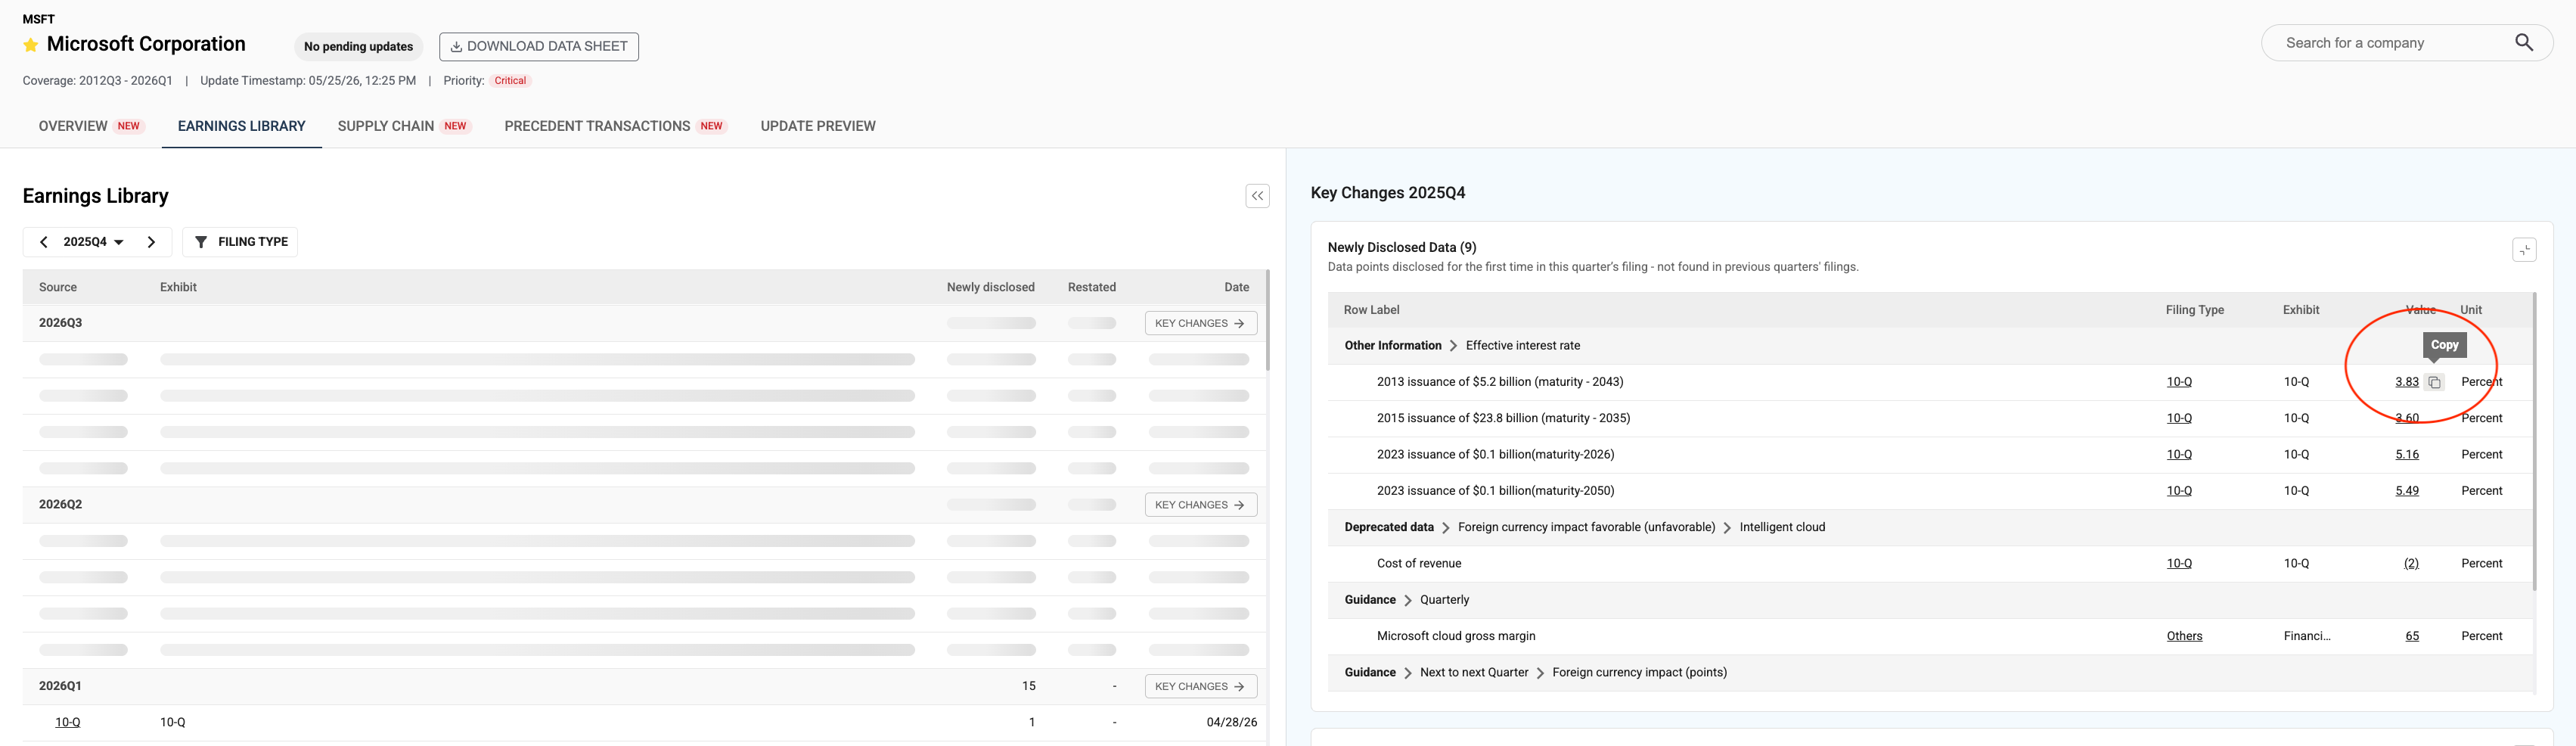
Earnings library
This tab tracks Key Changes by reporting period, split into Newly Disclosed Data and Restatements, with a detailed line-item view available for each.
Hover over a detail to copy it. When you copy a number, the Daloopa source link comes with it, so pasting into Excel brings both the value and its hyperlink. Text labels copy as plain text, without a link.
Supply chain
(Experimental feature, available for most large-cap U.S. companies. These are point-in-time snapshots, not updated in real time.)
Maps the company's supply chain: revenue exposure by customer, COGS breakdown, inventory flows, and gross margin correlations across the sector. It includes a supply-side stress test that estimates the revenue and margin impact at each level of the chain.
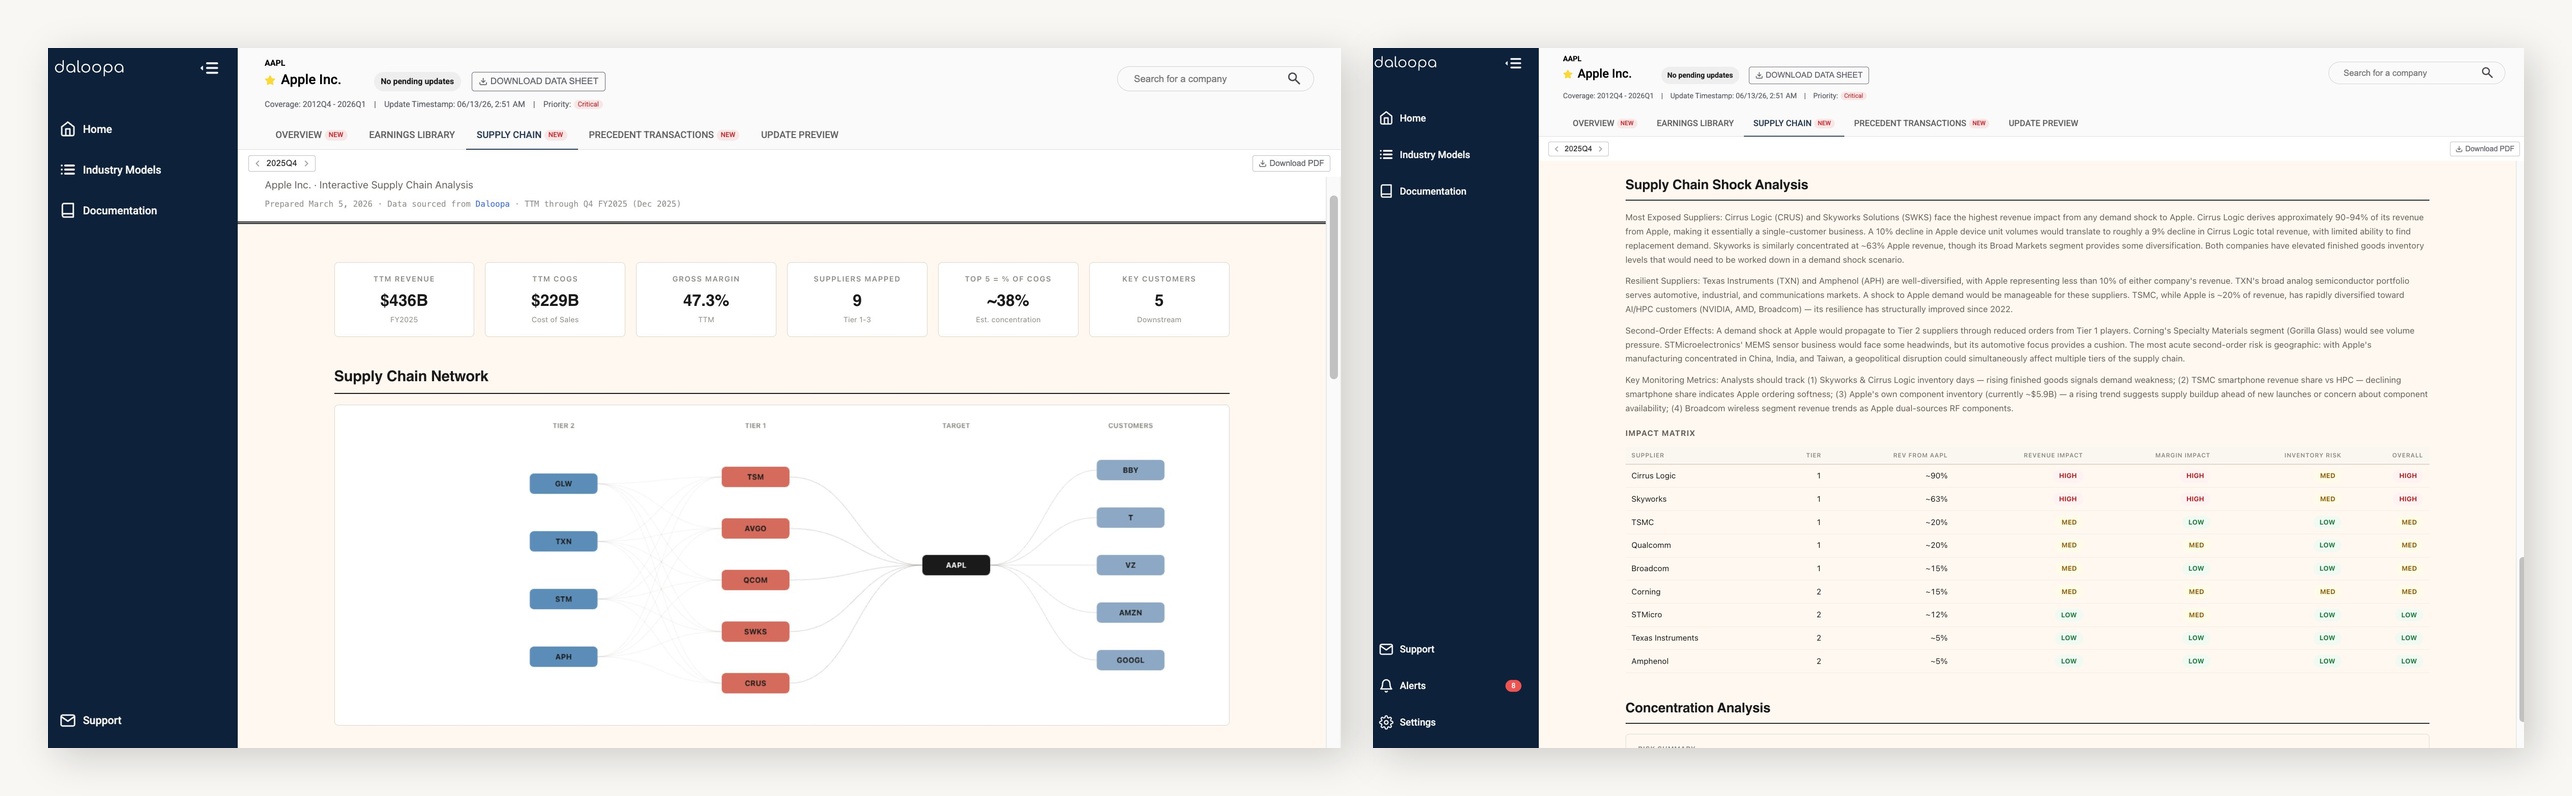
How is the data sourced?
This view is AI-generated using Daloopa data and public sources. The financial figures trace back to filings; the supply chain relationships and stress test are modeled, not disclosed facts. Verify anything you plan to rely on.
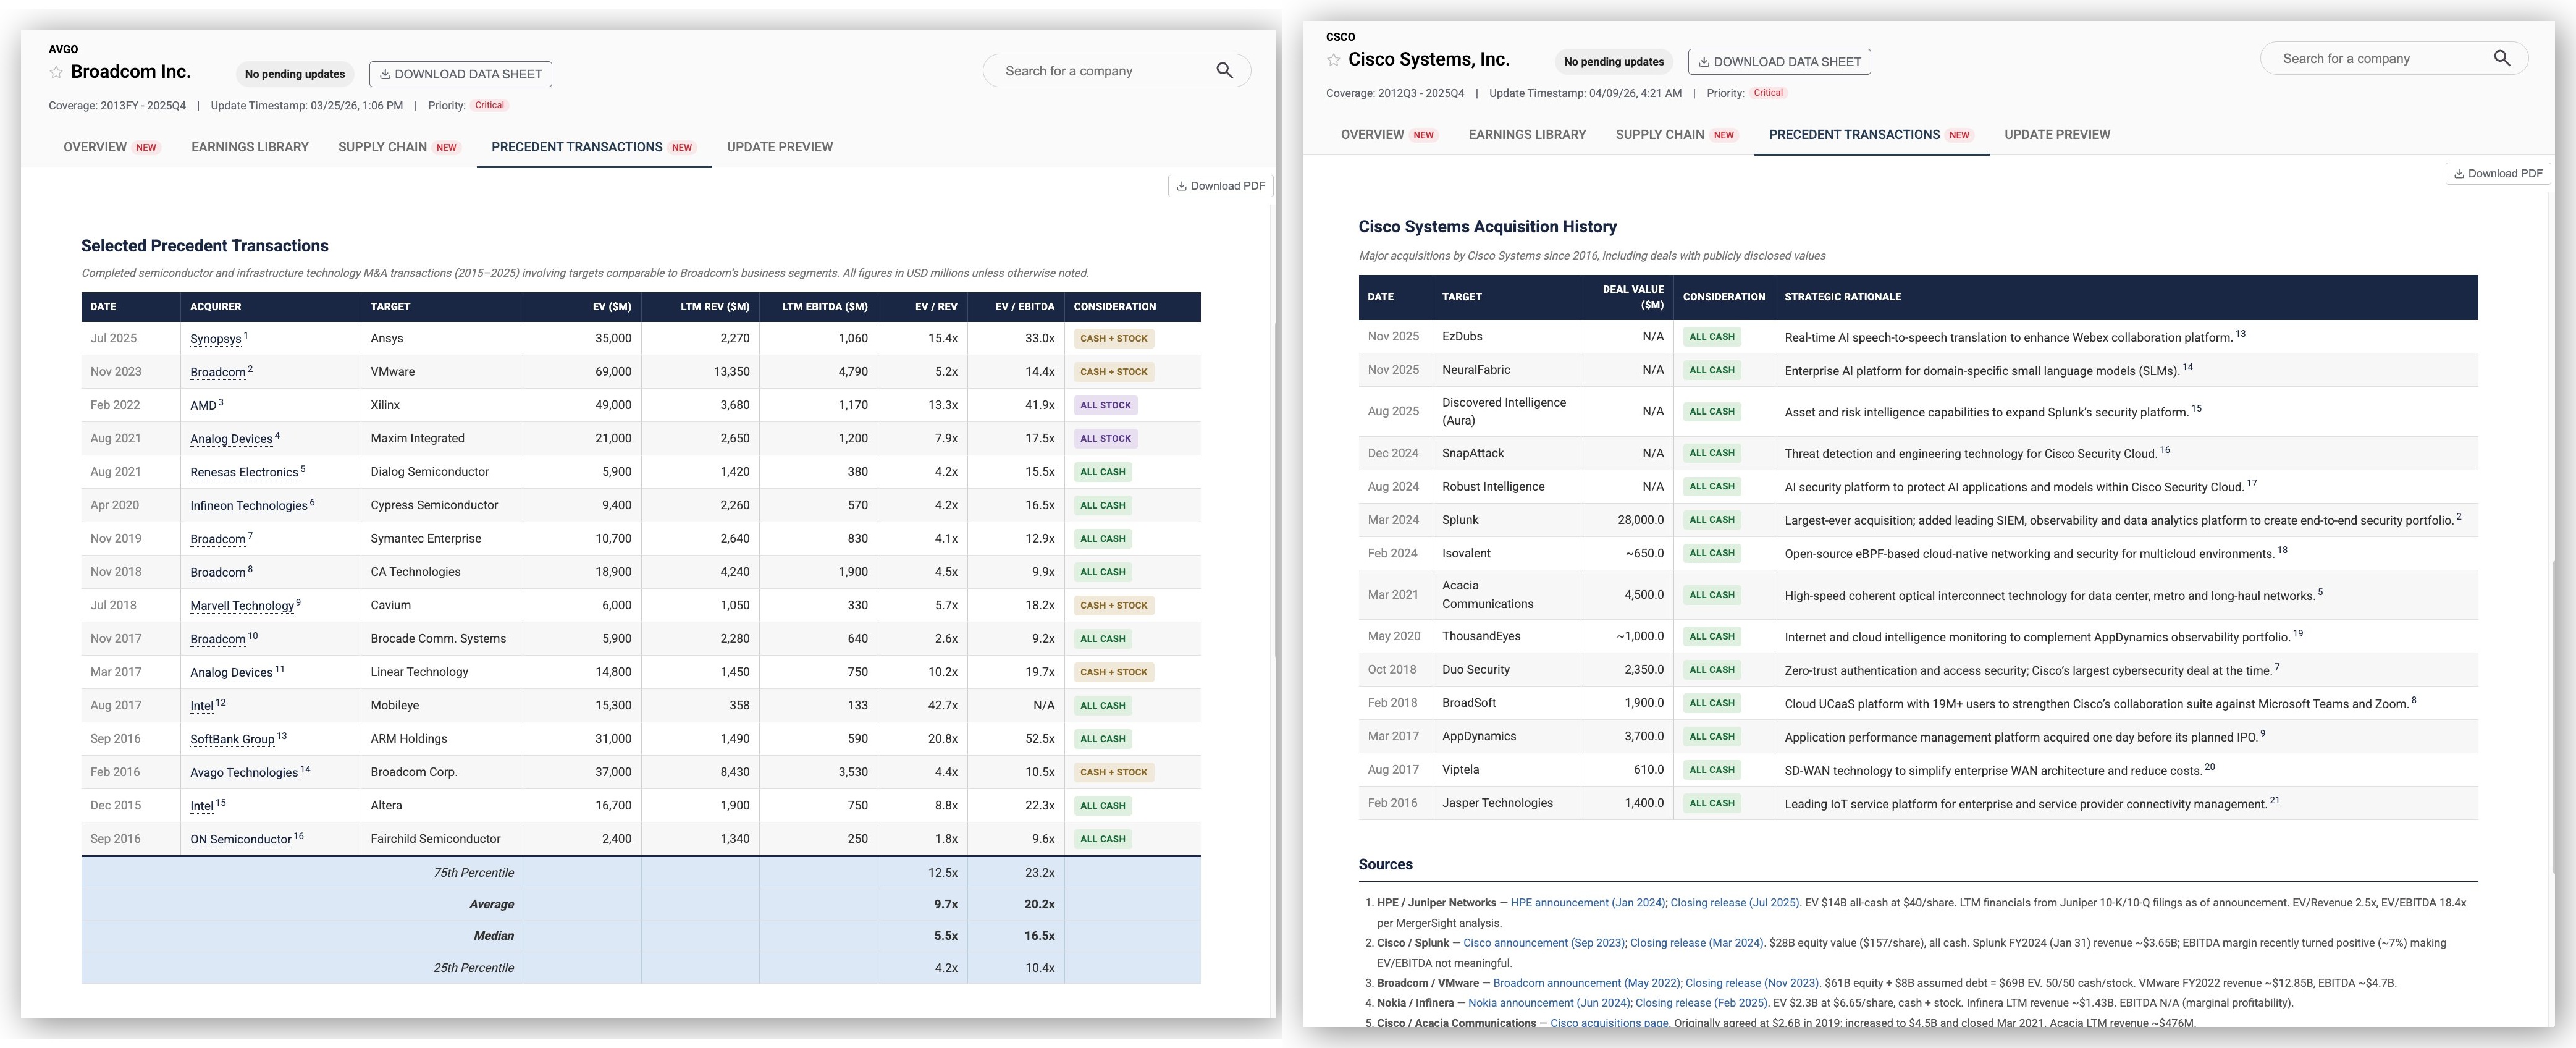
Precedent transactions
(Experimental feature, available for most large-cap U.S. companies. These are point-in-time views, not real-time feeds or deal trackers.)
Gives you precedent transaction comps for M&A and IPO research.
This content contains two parts:
- Comp table: A set of sector-relevant M&A deals, each with the deal date, acquirer, target, enterprise value, and pre-calculated EV/Revenue and EV/EBITDA multiples.
- Acquisition history: The company's own deals, with deal value, consideration type (cash, stock, or mixed), and a note on the strategic rationale.
How is the data sourced?
This tab is AI-generated using both structured Daloopa data and public sources. Verify figures and dates against the original filings before you rely on them.
Update preview
This tab shows two views of the most recent data: the latest four quarters of values for each fundamental, or the time each data point took to update. Switch between them using the Value / Update Time toggle on the right.
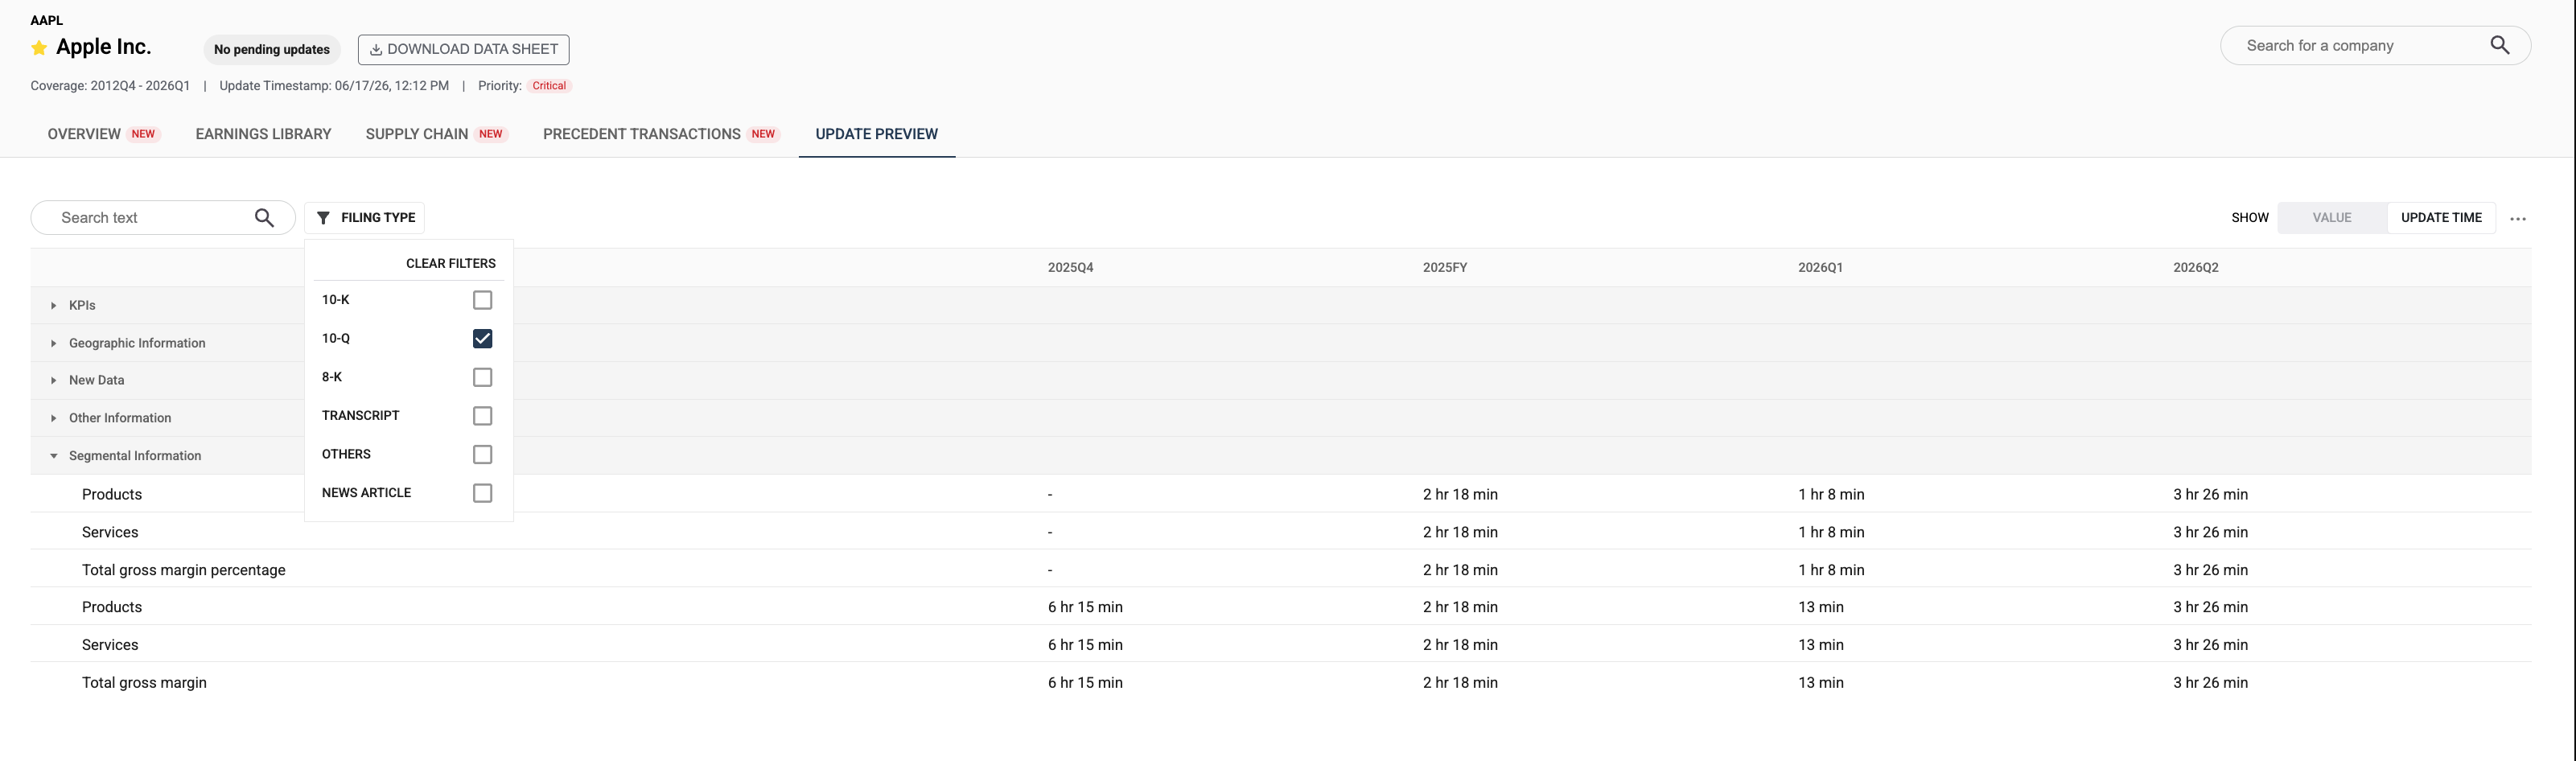
Use the search bar to find a specific series or datapoint by name. You can also adjust the number of visible periods using the period selector. By default the tab shows only rows with at least one value in your selected range; toggle "Show all rows" to include series with no data for those periods.
Updated 20 days ago