
Data Sheets
What's in a data sheet
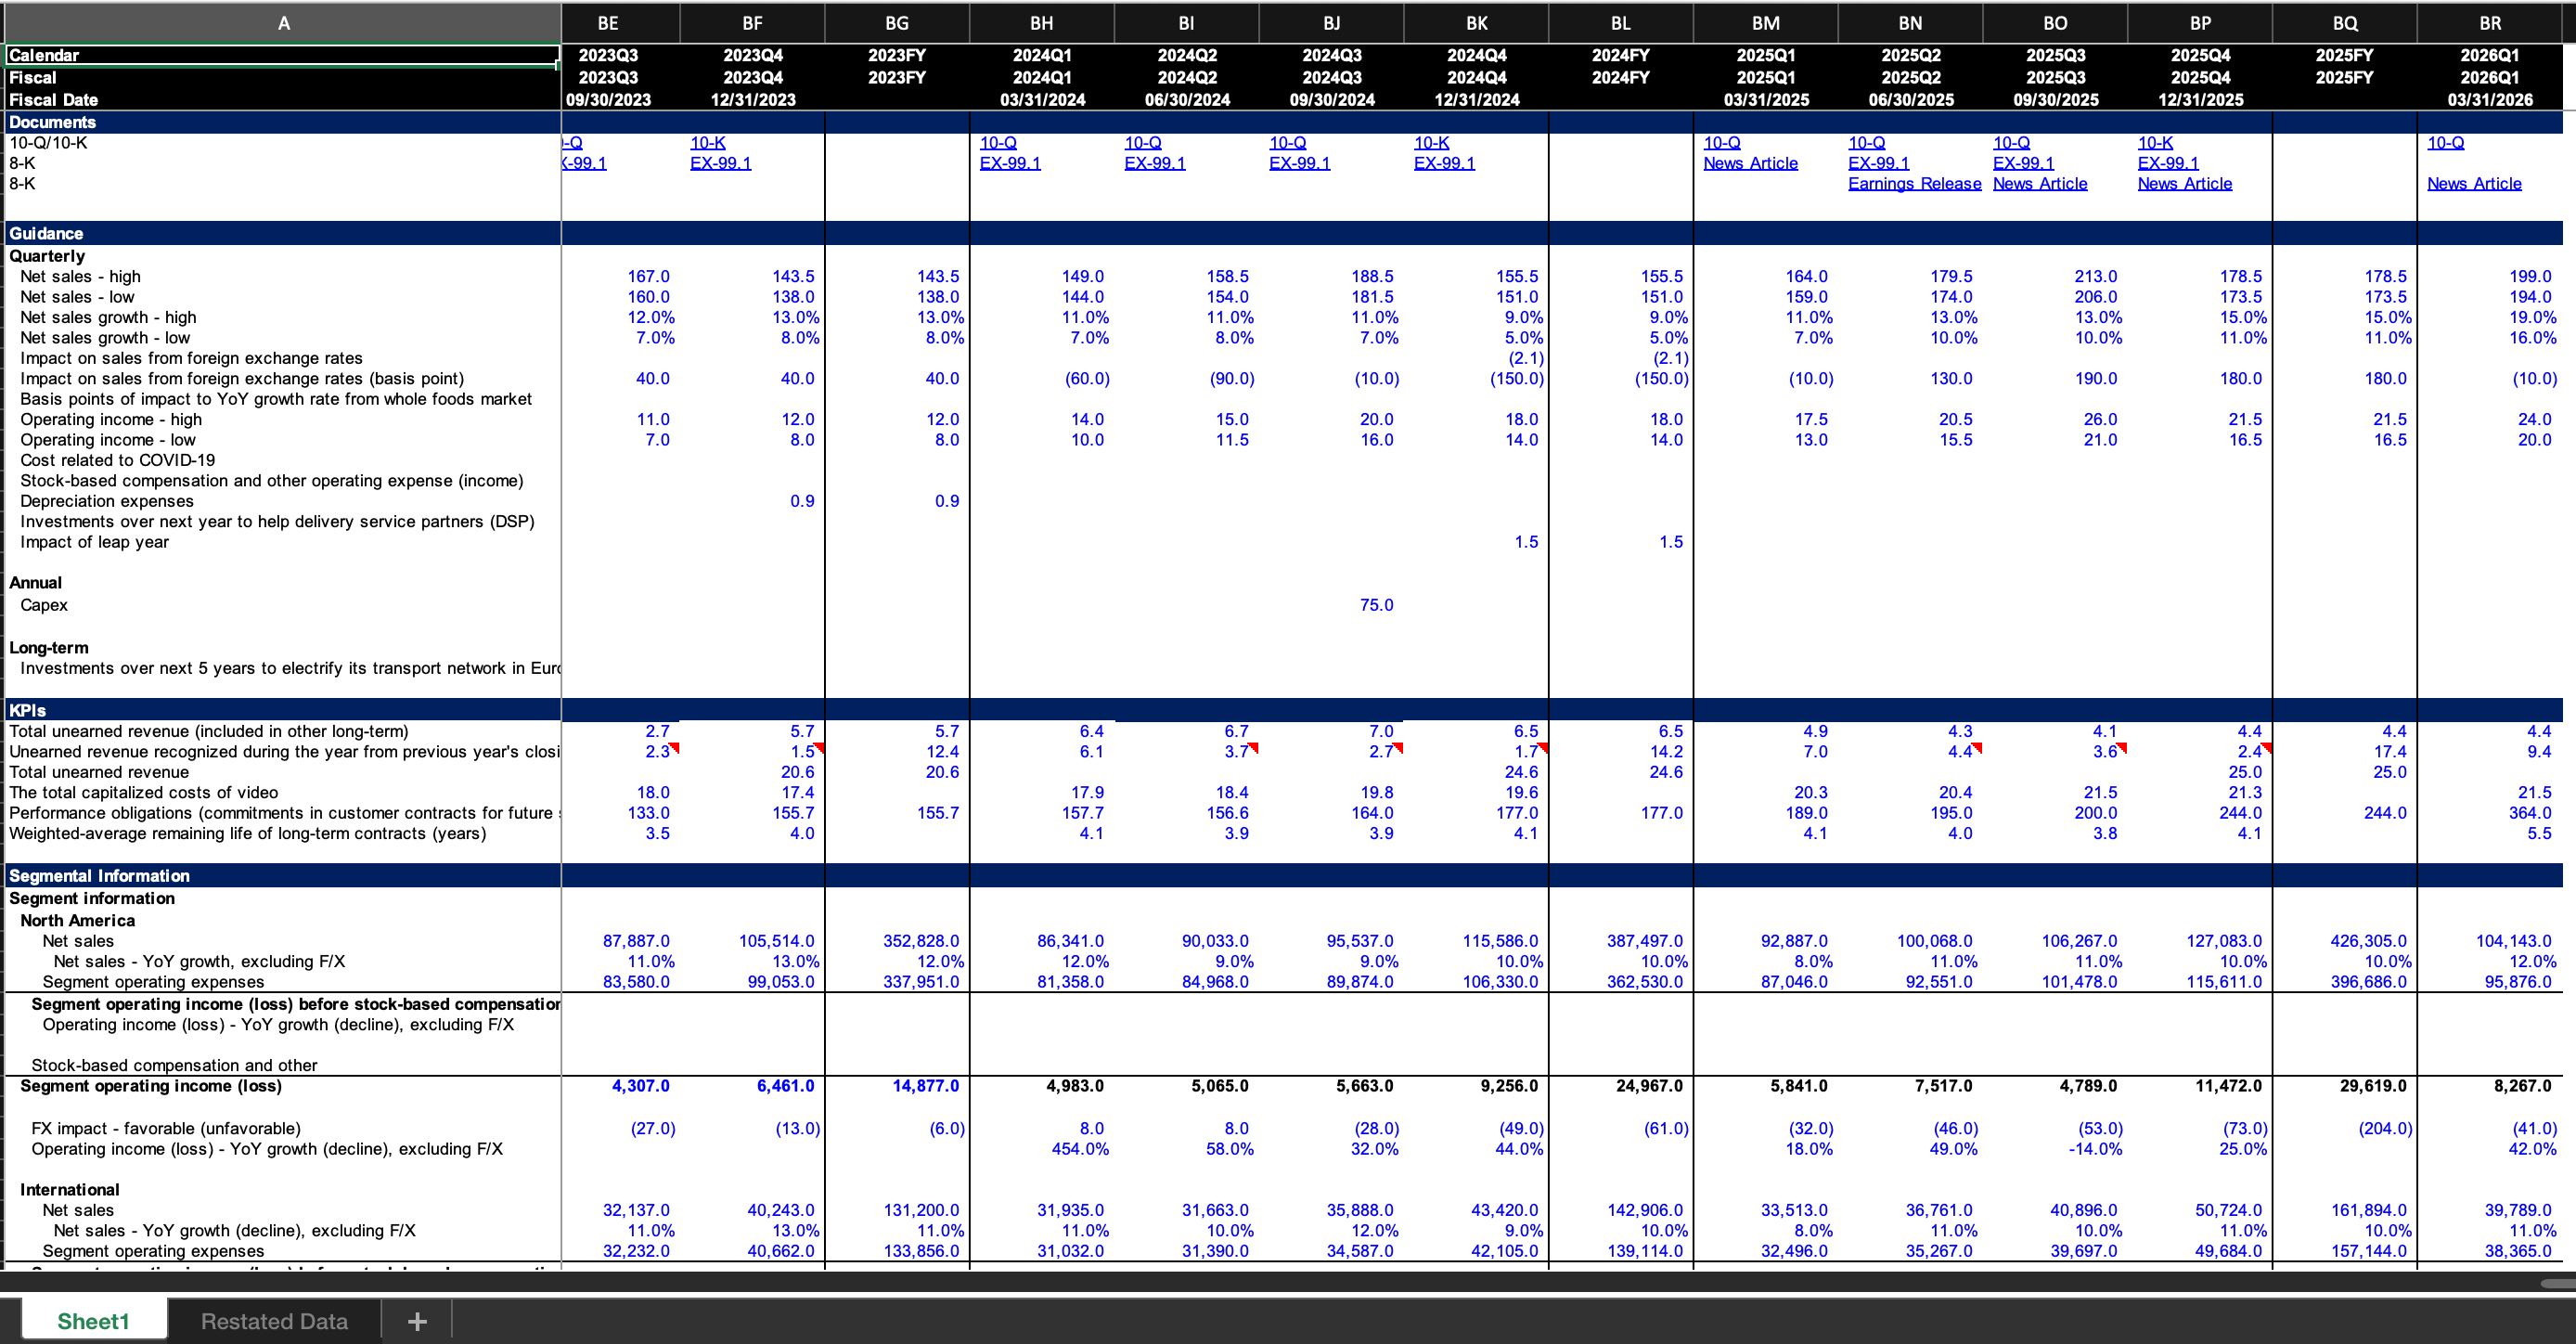
A Daloopa data sheet contains one company’s reported financials and operating metrics, organized in Excel with each number linked back to its source. You can read it, build from it, and update it like any other Excel workbook.
Sections
Each model is organized into these sections:
- Dates
- Documents
- Guidance
- KPIs
- Segmental breakdown
- Geographical breakdown
- Income statement
- Balance sheet
- Cash flow statement
- GAAP to Non-GAAP bridges
- Others
Where the data comes from
Daloopa collects data from public company filings, including:
- 10-K and 10-Q filings, and annual and quarterly reports
- 8-K filings (press releases and earnings releases)
- Investor presentations
How we collect it
We capture data as companies report it, without editing or adjusting it. When a company provides detailed line items, we include those line items in the model. We review each model multiple times to confirm both the reported values and the relationships between them.
We also capture data from tables, management discussion and analysis, footnotes, narrative text, charts, and graphs. As a result, a sheet may include more data than you need. You can safely delete rows you do not need. Removing rows will not affect updates or other functionality.
Reading a data sheet
A few conventions explain most of what you will see in a data sheet.
Cell colors
- Blue marks a hardcoded number taken directly from a filing. Each blue cell links to its source.
- Black marks a calculated number, such as an Excel sum of nearby cells.
These colors are separate from the highlight colors the add-in applies while updating a model. Update highlights show update status, not where a number came from.
Why some totals are calculated and some are hardcoded
When the components in a filing add up cleanly to the disclosed total, we write the total as an Excel sum, so it remains a calculated black cell. When rounding causes the components to differ from the disclosed total, we hardcode the disclosed total so the sheet matches the filing exactly. Either way, the cells link to their source.
Quarterized figures
Some figures are only reported on a year-to-date or annual basis. Daloopa derives each quarter by subtracting the earlier periods. For example, if a company reports [10, 20, 31, 42] year-to-date, the quarters show as [10, 10, 11, 12].
These cells are calculated, and each one links back to the disclosed figure it came from — so clicking 12 takes you to the 42. On the Hub source page, a separate table view shows the full calculation, so you can see how each quarter was derived.
Dates
Daloopa gives three date formats for every period:
- Calendar. The calendar period the quarter falls in, based on its mid-point. If the mid-point lands between Jan 1 and Mar 31, the period is Q1. For example, a fiscal quarter ending Apr 30 has a mid-point around Mar 15, so it maps to calendar Q1. Calendar periods are useful in industry models that compare multiple companies.
- Fiscal. The company's own fiscal period.
- Fiscal Date. The exact day the period ends, in
MM/DD/YYYY. To get the number of days in a period, subtract two fiscal dates in Excel.
Watch the fiscal dates for length changes. A company will sometimes shift a period end by a day — for example, ending Apr 1 instead of Mar 31 to add a day — and the fiscal date is how you catch it.
Units
Daloopa shows every figure in the most recent unit the company disclosed. If a company switches from thousands to millions, Daloopa converts the history to millions so the whole row is consistent.
If unit precision matters for your workflow, verify the value against the source filing. Your sheet can also include unit, source, and tag ID columns for added context — these are controlled by a download preference in the Daloopa Hub.
When disclosures change
- New breakouts, resegmentation, and M&A — When a company starts disclosing something new, Daloopa adds rows for it. Data the company stops disclosing stays in the sheet but is no longer updated. New rows arrive highlighted in yellow, and the update email calls them out.
- Renaming — When a company only renames a line — for example, "Revenue" to "Sales" — Daloopa keeps it as one item rather than splitting it, since the substance hasn't changed.
- Restatements — Daloopa records each figure as first disclosed. When a company restates a prior period, Daloopa covers the restated values for a growing set of companies. To see restated figures, or to check whether a company is covered, talk to your customer success representative.
Auditing to source
Every number in a data sheet links back to the exact place it came from in the source document, so you can verify it yourself.
Click any number in Excel to open its source location. If you copy a number from the sheet and paste it into an email, the source link stays attached, so the recipient can open the same source on any device.
The source link points to the exact location where the figure was taken from, not to a general search result in the document. The same figure may link to different locations depending on where it appears in the filing. For example, revenue in a segmental breakdown may link to a different place than revenue in the income statement.
Formula and roll-up hyperlinks
Data sheets can link more than individual numbers to source documents. They can also link calculated cells and rolled-up totals to the logic behind them.
Formula hyperlinks open a breakdown of the formula and the underlying fundamentals behind a calculated figure.
Roll-up hyperlinks work the same way for rolled-up totals. Some are built into the base sheet, and you can create your own using Create Rolled-Up Number in the add-in.
To build one, see Create Rolled-Up Number.
Industry models
Industry models vs. comp sheets
An industry model shows key KPIs across companies in the same industry. You can use it to compare operational performance, track share gains or losses, monitor inventory build, and identify margins that diverge from the group.
A comp sheet is different: it tracks company valuations over time. An industry model shows which companies are operating better or worse than peers; a comp sheet shows how their valuations compare.
Because industry models update as filings are released, you can spot company-level divergences sooner. For example, you can quickly see whether an automaker is building inventory faster than it is selling, or whether one restaurant chain is posting same-store-sales growth while the rest of the group stalls.
Updated 21 days ago